Freitag, 12. November 2010

Common tasks and how to do them with ScientificPlotter

As a user of ScientificPlotter you are getting the full experience of having a multifunctional application in your hand. ScientificPlotter distinguish between a numerical input and a formula in Cartesian-/Polar or Parametric-space.

So let's see what you can do, you can..:

  • type in an arbitrary calculation, e.g. 1/ln(5)  and see what you get
each entry in the history consist of its unique id, 
the expression you entered and the appropriate result 

  •  type in a function with the variable 'x', e.g. e^sin(x) 

 in this case  ScientificPlotter will assume you want to plot a function in Cartesian-space and
 will plot the function above in respect to the variable x
  • type in a function with the variable 'u', e.g sin(5*u)^2
 in this case  ScientificPlotter will assume you want to plot a function in polar-space 
and will plot the function above in respect to the angle 'theta' in the given bounds

  •  type in a function with the variable 'u' and in the form [f_1(u);f_2(u)], e.g. [sin(u)*u;cos(u)*u]
in this case  ScientificPlotter will assume you want to plot a function in 
parametric-space this time 'u' plays the role of a parameter not a angle!


In all cases above you are given the possibility to use a free scalable parameter 'k', so this can become very useful. Let us give you a brief introduction:

  • What if you want to plot sin(x) but with different frequencies? With our new parameter just type in sin(k*x) and hit the go button and a new pop-up window will show up asking you for three values: the start-value, the stop-value and the step size 
so for instance if start is 1 stop is 3 and step is also 1, 
'k' will go from 1,2 & 3 and you will plot sin(1*x); sin(2*x); sin(3*x)

And of course it is possible to draw several functions together; all you need to do is separate them with a semicolon, like 'function1; function2', e.g. x*sin(x);x;-x


Endian Ogino 

Donnerstag, 11. November 2010

ScientificPlotter - an security overview

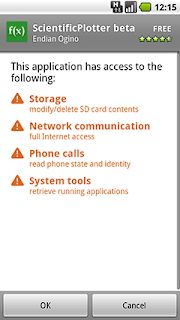
Security has become more crucial nowadays and specially on a mobile phone. Because of that, we want justify the permissions ScientificPlotter claims.


As you can see on figure the figure below, that we tried to keep the permissions as few as possible, basically there are only two permissions we need

Storage

This permission came up with a somewhat antiquated idea. Nowadays everything is shared over common ways: email, bluetooth, sms/mms, Picasa and so forth but if you just want to save the plot to your SD Card than this permission allow us to do it. In principle this is only for saving screenshots on your SD Card in a specific folder called ‘ScientificPlotter’.

Network communication

This permission is very important and we use it very dutiful. Well I don’t have to tell you that this permission gives us full Internet access, but what for? We have built in an open-source error reporting framework called ACRA (Application Crash Report for Android). This rather powerful framework is for the case which hopefully never should occur, a bug. When an unexpected error occurred forcing the application to stop, ACRA send a notification to your notification bar, asking you for allowance to send the error report. And because the system is open-source you can convince yourself that it does nothing evil. 

A common error report 
  
The information we send consists of hardware and software information, as there are the manufacturer, the model, the firmware, the Android version, how many memory was available as the error occurred, when does it occurred and the significant stack trace which give us access to the root of the error. 

Advertisement

As you probably noticed ScientificPlotter is ad-supported by the Mobclix ad-exchange service. To ensure that the advertisement banners are provided properly, the Mobclix SDK needs additional three permissions. These three permissions and their description are extracted from the manual:

android.permission.INTERNET
Used to retrieve ads

android.permission.GET_ TASKS
Used to determine if the application is the top app, to prevent ads from loading while the app is in the background.

android.permission.READ_PHONE_STATE
Used to obtain a unique device identifier.

Endian Ogino 

Samstag, 6. November 2010

ScientificPlotter on the Samsung Galaxy Tab

Hello everyone, I recently got the chance to run my app on a Samsung Galaxy Tab, because this is by far the only tab which got Market access. This was a great chance for me because I had tested ScientificPlotter on a variate of devices but a tablet was still unreachable. To make a long story short, ScientificPlotter managed to cope with the tab. Everything just runs smoothly and nice looking like on a normal mobile device. Here are some pictures I made with my Droid


Endian Ogino

Mittwoch, 3. November 2010

Interview with Robert K.

As mentioned earlier, we have started a new survey about ScientificPlotter. Today we're interviewing Robert K., maker of the Android app Sticky Note Cork&Orc. They have a cool concept that allows you to save your notes easy and well-arranged. A demo of his app can be found on Youtube.

In an interesting conversation with Robert, he was so kind to give us a short interview, let's get into it:

-How do you heard about ScientificPlotter?
*Through the AndroidPIT-Forum

-How often do you use ScientificPlotter?
*As often as I require it, mostly several times per day

-Which kind of input you prefer?
*The calculator buttons.

-How do you like the interaction model in the plot window?
*I had no problems with it so far.

-What feature are you missing?
*At moment I'm pleased with the current set of features. I'm looking forward to any new update though.

Dienstag, 2. November 2010

Survey about ScientificPlotter

We posted an survey to improve ScientificPlotter. We would be pleased if you spend 2 minutes to help us.

Montag, 1. November 2010

ScientificPlotter - a user guide


It's release day! Earlier this day we release ScientificPlotter on the Android market and we gathered our first downloads. Since ScientificPlotter is release in the beta state, there are still a lot of work to be done, and hopefully with your support.

Now we would like to start with a series of posts about how to work with ScientificPlotter and how to get the most and best for you interest. But at first let us cover how to interact with the plot window:

The plot window overall consists of three axis (one x axis and two y axis), a label and a legend which are independent configurable. We implemented several touch gestures you can use to interact either with the window or with a single axis (except the long press gesture). The gestures and their functions are listed below: 
  • Touche Move
  • When a finger is placed on the screen and then moved, you drag the plot resp the axis in this particular direction
  •   Long Press
Holding your finger for several seconds on the area around the legend you can hide resp. show the legend

  •  Single Tab
By single tabbing on the plot or an axis you zoom out all axis or only the desired one

  •  Double Tab
By single tabbing on the plot or an axis you zoom in all axis or only the desired one
  •  Pinch Zoom
Pinch zooming gives you a more comfortable way of zooming in or out the plot or a single axis
 
  • DPad resp Trackball 
Last but not least, we make use of the dpad resp. trackball if available.  Those you can use to move the plot very precisely, by moving in the relative direction


 As you can see we tried to give you the full accessibility to our plot, so you can decide what you see and how you want to see it.
 We gratefully acknowledge the acceptance of gestureworks for using their gesture images.